Everyone makes mistakes. Even the greatest minds in history have made terrible blunders at one point or another. The difference between those who excel and those who struggle is how well they handle failure. People who thrive after a failure don’t let their ego get the best of them. They take a step back, look at what went wrong, and then figure out how to avoid that mistake in the future. Learning from your mistakes is one of the best ways to grow as a person, but it isn’t easy. There are many different ways to increase your resilience after a mistake. One of the most effective is creating an Ishikawa diagram that allows you to document all of your company’s failures and learnings throughout the year.
If your business is not on the internet then your business will be out of business. You can request publication of your article for publication by sending it to us via our Email below. businesshabblog@gmail.com or SMS/WhatsApp) or call +2347034920650. Click here to start business now with businesshab.com
businesshabblog@gmail.com
9 Ways to Create a Lesson Learned Diagram (Ishikawa Diagram)

It’s normal for teams to encounter issues or problems during the execution of a project. The team learns from these problems and either implements changes in their process or adjusts their strategy moving forward.
In other words, the team creates a lesson learned document to capture their understanding of why something happened, what caused it to happen, and what they could do differently next time.
These insights help reduce the risk of encountering similar issues in the future and make projects more efficient. For example, if you have a problem with your supply chain again next year, you can quickly access all the information you need without running into any hiccups.
A lesson learned diagram (Ishikawa diagram) is one way to document your findings so that you can refer back to them easily as needed. In this blog post, we look at 9 ways that you can create an Ishikawa diagram as part of your project’s post-execution review.
1. What is a lesson learned diagram?
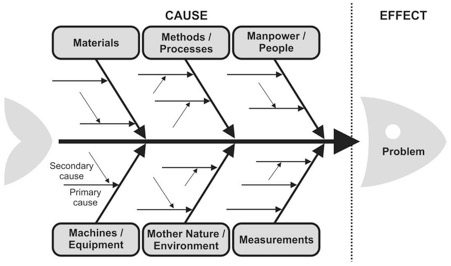
One of the main reasons businesses create a lesson learned diagram is to identify the root causes of problems. This allows businesses to create a roadmap for fixing the root causes of problems and identifying new problems as they arise. There are many names for this type of diagram, including fish bone diagrams, root cause analysis diagrams, and Ishikawa diagrams. These diagrams are typically used to visualize the factors that contribute to a problem, such as defects, accidents, or project failures. The purpose of creating a diagram like this is to encourage people to brainstorm and think outside of the box. It also allows people from different areas to collaborate on ideas.
2. Why create an Ishikawa diagram?
The best way to learn from failures is to first document them, and then create a plan for what to do next. A lesson learned diagram can help you to do both of these things. The diagram is a visual representation of all the things that contributed to a failure. It allows you to see the bigger picture, rather than getting stuck in the details of one particular failure. With a diagram, you can see what led to the problem, which in turn allows you to come up with solutions to fix the problem at a source level. A diagram can help you to identify the root cause of a problem. It will also help you to see if similar issues are affecting other areas of your business. This can help you to prioritize what to fix and what to keep an eye on.
3. How to create an Ishikawa diagram
Before you start creating your diagram, make sure you’re clear on what you want to achieve. This might sound obvious, but it’s easy to get caught up in the diagram-making process without a clear goal in mind. Next, gather information about current processes. This is where the diagram will start to come together. Organize what you know about the problem into a diagram. This might include information about people, products, and other aspects of the business you want to include. Try to avoid gathering information from investigations that are currently underway. This can cause you to get stuck in details and miss the bigger picture.
4. Define the problem you’re trying to solve
Identify the problem you want to solve. Is it a problem with a product launch? An issue with customer service? Or perhaps a manufacturing problem? You can use a diagram to solve any problem that impacts your company. It could be something specific to get a product out of beta testing or a problem that keeps happening every few weeks. The problem can also be something much more broad, such as customer satisfaction levels.
5. Collect information about the current process
This might seem like a no-brainer, but it’s essential to know the current process before you can create the diagram. You can ask people to write down the current steps they go through when completing a task. You can also use software to record customer journeys or capture information about current processes. You can also start by looking at the issues you want to solve, and then look to see if anything stands out with the current process.
6. Define why the current process doesn’t work
Once you’ve got a good idea of the current process, it’s time to get into the details. You can identify the root cause of the problem, and then write it down. For example, let’s say the problem is that your customers are complaining about the quality of your products. To identify the root cause of this problem, you might do some more research and talk to customers to find out why they’re unhappy. Finding the root cause might take some time, but it’s essential to get it right. This is because it will determine the type of solution you can implement going forward.
7. Define your desired outcome for the new process
This is where you get to dream big and imagine what your ideal solution would look like. The diagram will help you to see what you need to do to achieve this outcome. Depending on the problem you’re solving, you might need a solution that addresses the root cause of the problem or fixes a symptom of the problem.
8. Create a timeline for when things should happen
This is where you write down when certain things should happen. You can use this section of the diagram to show other departments or teams when they should be involved in the process. Or you can use it to show when certain problems should be addressed. For example, let’s say your product isn’t suitable for younger children. You can use the diagram to show when this problem should be addressed, such as when your product design team creates a new toy.
9. Takeaway
A lesson learned diagram is a great way to get to the root cause of problems. It can help you to understand why something is happening, so you can fix it. Once you’ve identified the root cause of a problem, you can use the diagram to find the best solution for fixing it. This will help you to avoid the same problems in the future and make improvements going forward.